

Analyze data and convey ideas clearly with Graph Builder™. The legendary Graph Builder has been developed with over two decades of industry collaboration, is the first graph and analysis application available for Mac OSX, is also available for the iPad and is VVIs flagship product. It is a powerful application rich in graphic and data editing and programming to facilitate the visualization and analysis of information.
FEATURES
Data analysis
• Statistics: Outputs trend, mean, standard deviation, median, range and regression values.
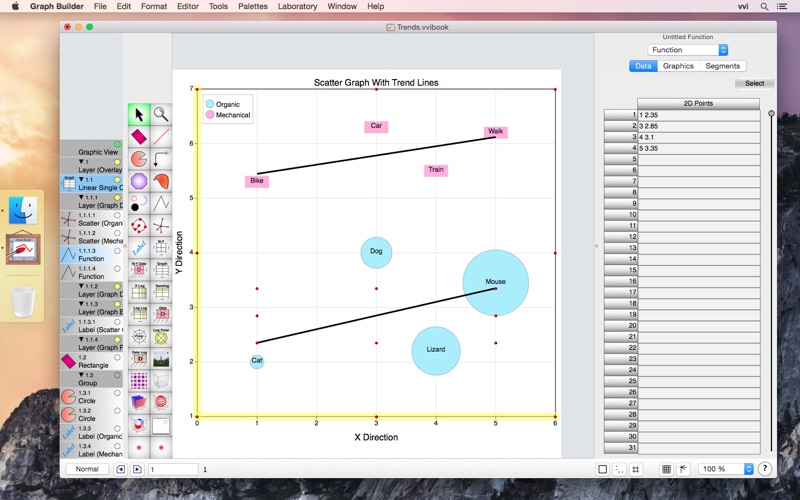
• Drill Down: Data points are individually inspected and modified directly either in numeric form via tables or graphically by point, click and drag on a curve.
• Trend Lines: Trend lines are overlaid using a menu tool.
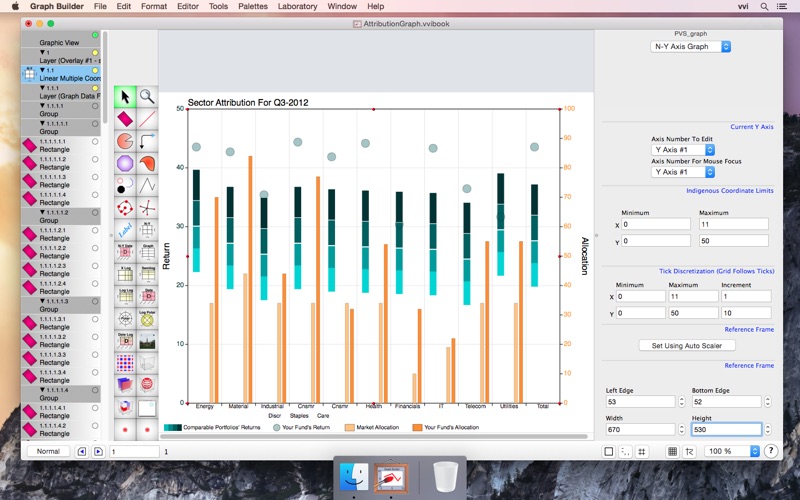
• Comparisons: Documents accept multiple graphs and data sets so direct comparisons can be made.
Data visualization
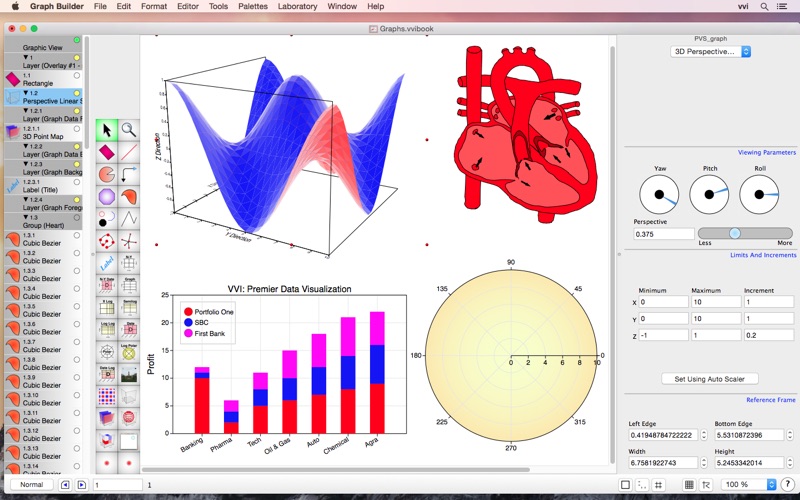
• Graphs: Linear, One to Sixteen Y Axis Linear, Log, Semi-Log (X and Y directions), Log-Log, Full-Cycle and Sub-Cycle Log, Polar, R-Log Polar, Date, One to Sixteen Linear Y Axis X-Date, Date-Log and 3D Rectilinear Perspective.
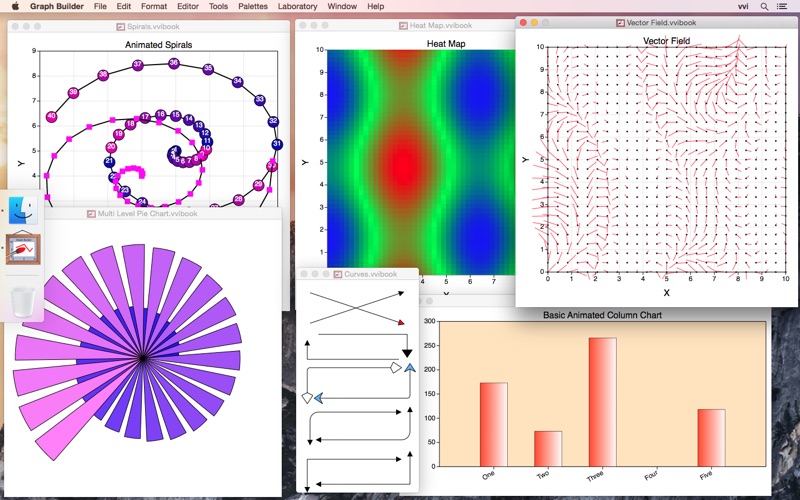
• Data Graphics: Function (Line), Scatter, Trajectory, Heat Map, Vector Map, 3D Surface, 3D Scatter and 3D Density (Volumetric), Bubble, Error Bars.
• Chart Tasks: Chart tasks take data and make graphs. You can make a simple line graph to more unusual polar-heat-map graphs.
• Data Attributes: Dashes, markers and labels. Unlimited capabilities to make new markers and end caps.
• Graph Attributes: There are a large amount of tunable graph attributes including grid and subgrid color, width, dash, limit values, tick and subtick placements, color, length, width, label format, frame and background color, title values and placement, font type and size, label angles, offsets and gaps.
General graphics
• General Graphics: Line, Rectangle, Oval, Parallelogram, Circle, Ellipse, Pie Wedge, Curve, Polygon, Cubic Bezier Sections, Path, Label and Image graphics.
• General Attributes: Shadow, diffusion, gradients and standard fill and stroke type effects.
• Real-Time: Attributes edit and change in real time. 3D graphics rotate and update in realtime.
• Editing: Point-wise vertex and spline knot editing, smoothing, a large quantity of direct attribute inspector editing, rotate, skew, copy, paste, delete, etc.
• Palettes: Includes standard palettes for drag and drop creation and the ability to create your own palettes.
• Export and Import: Export figures to PDF, print them, or copy the data directly. Importing data is as simple as pasting a space delimited sequence of numeric text values. Export high resolution images into your favorite applications like Power Point.
• Documents: Stores results in a Graph Builder document.
• High-Level Design: You are never trapped into a limited design. For example, you can have any marker because markers are graphics and the editing and graphic design is recursive.
• Metadata: Assign metadata for Spotlight use.
Scripting
• Scripts: Generate data, move and animate graphics dynamically using the built-in script engine.
Standard OS X services (included with Graph Builder)
• Quick Look and Spotlight Plugins: Quickly browse and search all Graph Builder documents on your computer using familiar tools that utilize Quick Look and Spotlight services such as the Finder.
Network Graphing Server
• Preference option turns on the built-in graphing server.
• Display dynamic and programmed results over the web (requires a web server*).
Programming (requires Xcode*)
• Plugin: Load a plugin you write with Xcode to integrate your own codebase and algorithms.
• Application: Use Xcode and Graph Builder to develop your own graphing applications (requires a separate license).
Documentation
• Manual: The integrated manual explains features, is searchable and includes a table of contents and other browsing features.
iPad (requires Graph IDE*)
• Work with documents on your iPad or the Mac.
* separately available